Hvordan fungerer 831L Profiling Sonar?
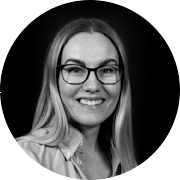
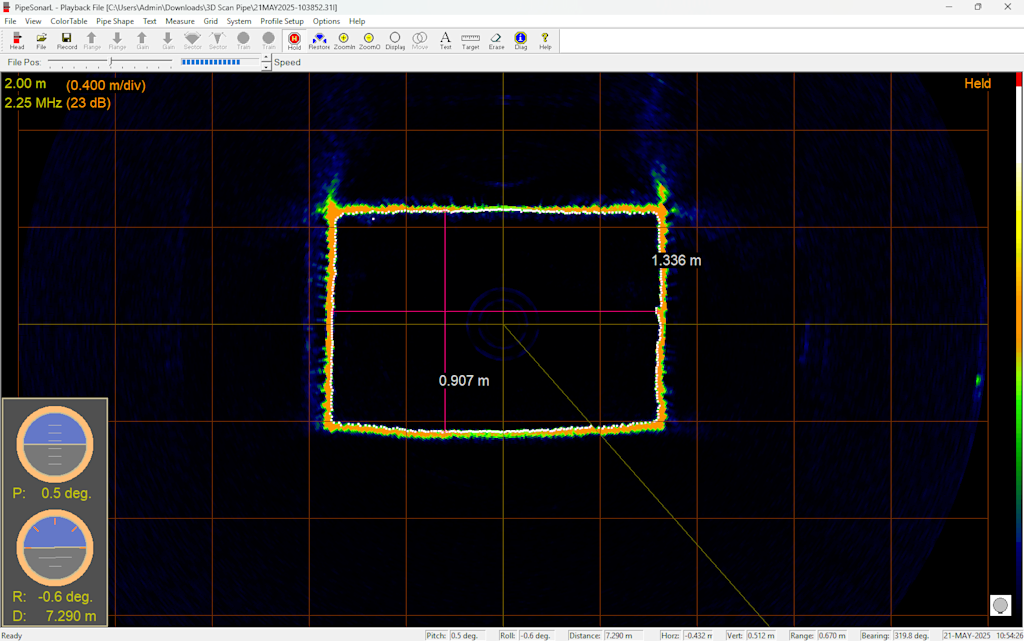
831L Pipe Profiling Sonar er en énstråle, mekanisk roterende sonar som roterer 360° for å gjøre flere målinger av avstanden fra sonaren til veggen i røret eller tunnelen. Sonarstrålen er smalere enn i en 2D-bildesonar, siden målet er å fange en smal profil eller punkt fra røret. På én meters avstand fullfører 831L en full 360°-skanning på bare 1,3 sekunder.
Sonaren tegner et tverrsnitt av røret som kan brukes til å visualisere den indre strukturen, oppdage feil eller måle oppsamlet sediment.
831L-sonaren har en operativ rekkevidde fra 0,125m til 6m. På grunn av den kompakte størrelsen til Blueye X3 og 831L-sonaren, kan man fange profiler i rør fra 80cm i diameter opp til 12 m.
Fra 2D to 3D
831L-sonaren fanger 2D-data i form av punkter fra senteret av sonaren til veggen i røret. For å kunne vise dataene i 3D trengs det også informasjon om Z-aksen. Programvaren PipeSonarL som styrer sonare, støtter mottak av ekstern informasjon om hvor langt inn i røret man har beveget seg. Tidligere ble dette målt med mekaniske kabeltellere.
På Blueye X3 brukes en DVL (Dopler Velocity Log) som måler hastighet over bakken og kan fungere som en kilometerteller. I Blueye-appen kan du nullstille denne telleren, for eksempel når du går inn i et rør som skal inspiseres.
Som en del av vår integrasjon med 831L-sonaren har vi lagt til koder som videresender avstandsinformasjon til PipeSonarL. Verdien fra DVL vises inne i programvaren og inkluderes i sonaropptakene.
Etterbehandling og analyse av 3D-data i CloudCompare
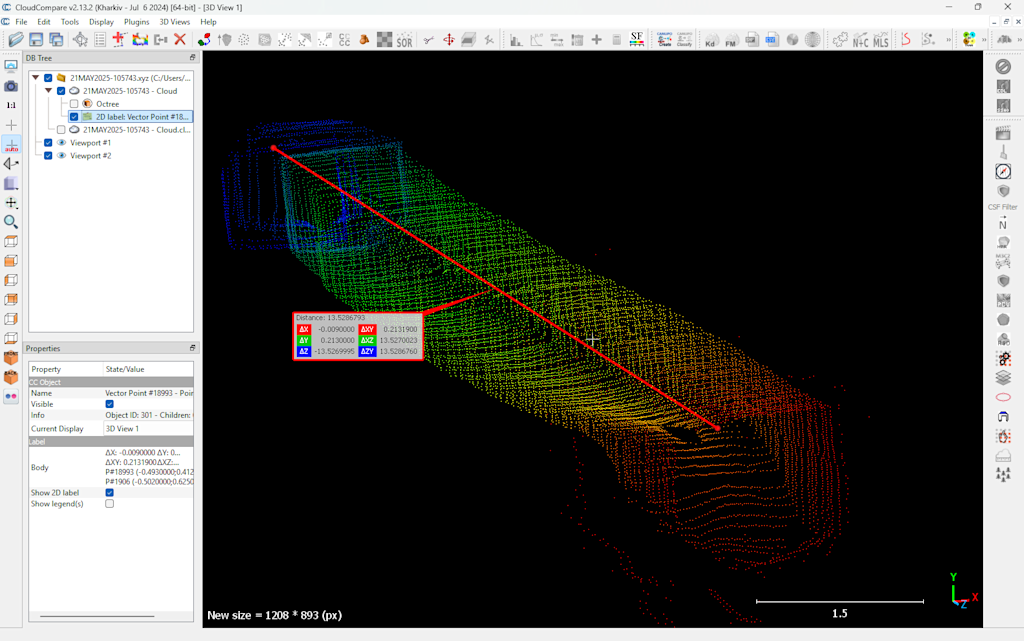
PipeSonarL kan eksportere en XYZ-fil, som er en tidsstemplet serie med 3D-punkter. Dette formatet kan viderebehandles og visualiseres i mange programmer. CloudCompare er et kraftig, åpen kildekode-verktøy for visning, rensing og analyse av 3D-punktskyer og -modeller.
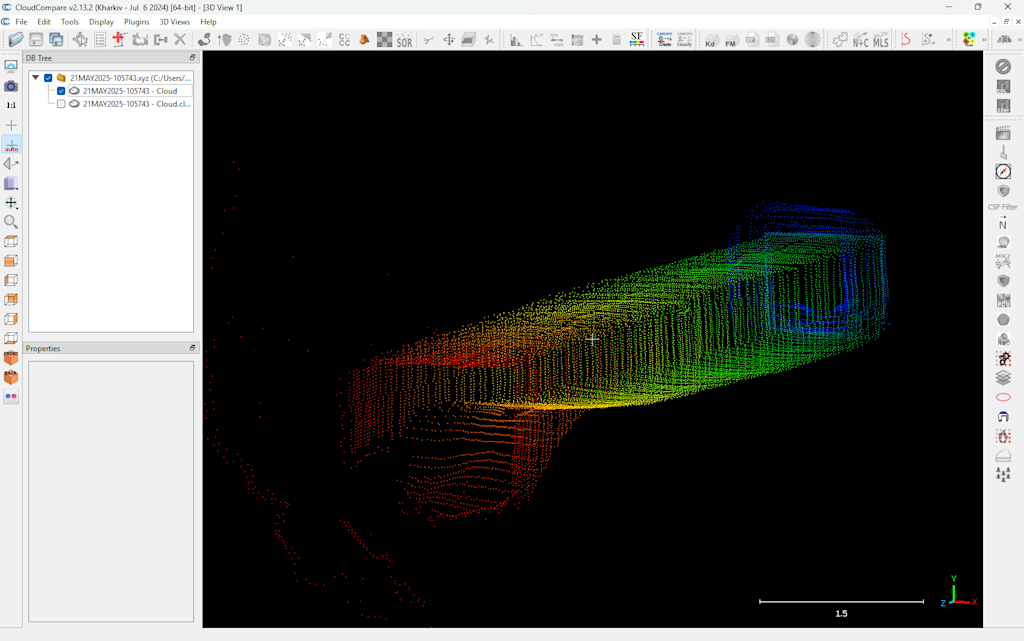
Ved å importere XYZ-filen i CloudCompare kan vi bruke filtre for å rense punktskyen og fjerne uteliggere. Deretter kan vi legge til et skalarfelt basert på punktindeks, noe som gir dybde og retning til visualiseringen. Fargegraderinger og varmekart kan brukes for å fremheve detaljer.
Vi kan måle avstand mellom punkter i punktskyne, og ser at denne skanningen er omtrent 13,5 meter lang.
For å animere modellen, kan man lagre flere visningspunkter og bruke animasjonspluginen i CloudCompare for å lage en video som beveger seg mellom dem. CloudCompare har mange funksjoner som ikke dekkes i denne artikkelen, men det finnes en aktiv brukergruppe og mange YouTube-videoer som forklarer hvordan programmet brukes.
Deling av 3D-modellen på nett
Fra CloudCompare kan modellen eksporteres som en PLY-fil (Polygon File Format), som kan lastes opp til 3D-delingsplattformer som Sketchfab for enkel deling og visualisering direkte i nettleseren.
Oppsummering
Imagenex 831L Pipe Profiling Sonar, kombinert med Blueye X3 og integrert DVL, gir en kompakt og svært kapabel løsning for inspeksjon av undervannsledninger og tunneler. Enten du skal dokumentere strukturelle forhold, oppdage feil eller vurdere sedimentoppsamling, gjør systemet det mulig å generere nøyaktige 2D- og 3D-profiler. Ved å eksportere dataene til verktøy som CloudCompare og Sketchfab, blir det enklere enn noen gang å analysere og dele detaljerte visualiseringer av dine undervannsressurser.
Du kan lære mer om de tekniske spesifikasjonene til Imagenex 831L Pipe Profiling Sonar på produktsiden vår..